A Python script to disassemble a block in LLDB
This is a repost of an article I published on the Realmac Software blog.
In a previous article I discussed how to debug Objective-C blocks with LLDB and in particular how to disassemble the block’s invoke function.
While not particularly difficult per se, the process was slightly tedious, involving quite a few steps. It would be nice if we could automate these steps. Luckily, LLDB has a very powerful script bridging interface where the entire LLDB API is available as Python functions.
In this article I’ll go through the creation of a Python script that we will be able to invoke from the LLDB debugger.
Before we dive into it, I suggest that you first have a read through the previous article. The test program code is shown below.
// clang -framework Foundation -fobjc-arc -o block block.m

#import <Foundation/Foundation.h>

@interface HelperClass : NSObject

- (void)doThingWithBlock:(BOOL (^)(NSString *arg1, NSInteger arg2))block;

@end

@implementation HelperClass

- (void)doThingWithBlock:(BOOL (^)(NSString *arg1, NSInteger arg2))block
{
    block(@"Oh Hai", 22);
}

@end

int main(int argc, char **argv)
{
    @autoreleasepool {
        HelperClass *object = [HelperClass new];

        NSInteger capturedInteger = 2;

        [object doThingWithBlock:^ BOOL (NSString *arg1, NSInteger arg2) {
            NSInteger someInteger = arg2 + capturedInteger;

            printf("%p %li\n", arg1, someInteger);

            return YES;
        }];

        return 0;
    }
}
If you launch the debugger, attach it to the program, set a breakpoint at the start of the doThingWithBlock: method and run you should be able to print the block argument by typing po block in the LLDB prompt once the breakpoint has been hit.
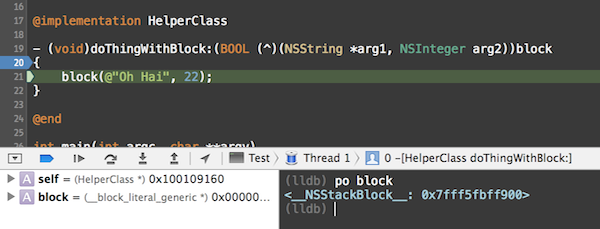
As you can see, the description only gives us the class and address. We could now manually read the memory at this address and figure out the address of the invoke function based on its position in the block structure in order to disassemble it. Similarly, we could have a look at the block descriptor struct and determine whether the block has a signature so that we can feed it to NSMethodSignature to get a print of the arguments and return value.
This is exactly what our script will do!
In order to use the script in an embedded python interpreter using LLDB we can import it by running the command command script import /path/to/block.py.
When doing such, the module initializer is being run. We thus need to implement this initializer and register the command with LLDB
def __lldb_init_module (debugger, dict):
	debugger.HandleCommand('command script add -f block.block_disass_command block_disass')
	print 'The "block_disass" command has been installed'
Now that our command has been added, we need to implement the block_disass function
def block_disass_command(debugger, command, result, dict):
We use the shlex module to split the command string using shell-like syntax. We then use the optparse module to parse the command arguments and options.
Once we have retrieved all the arguments (and done some validation) we will need to retrieve the current target, process, thread and frame. In a command, the lldb.* convenience variables are not to be used and their values are undefined. We thus need to access these objects as following
target = debugger.GetSelectedTarget()
process = target.GetProcess()
thread = process.GetSelectedThread()
frame = thread.GetSelectedFrame()
With the current frame and the variable name, we can proceed to retrieve the actual variable. We do this by using the FindVariable function on SBFrame. This function returns an SBValue. After checking that the value is valid, we can get the address by invoking the GetValueAsSigned function on the value. If the value is not valid, we check whether the argument was originally an address by using the int function to convert the string into an integer.
variable = frame.FindVariable(variable_arg)
if variable.IsValid():
	address = variable.GetValueAsSigned()
else:
	try:
		address = int(variable_arg, 0)
	except:
		print "The argument is not a valid address or variable in the frame"
		return
As this point, we can assume that we have a valid address for the block and we can proceed with finding its invoke function and disassemble it.
It is worth remembering the block structure (that you can find in the Block_private.h header on the LLVM website).
struct Block_literal_1 {
    void *isa;
    int flags;
    int reserved;
    void (*invoke)(void *, ...);
    struct Block_descriptor_1 {
        unsigned long int reserved;
        unsigned long int size;
        void (*copy_helper)(void *dst, void *src);
        void (*dispose_helper)(void *src);
        const char *signature;
    } *descriptor;
};
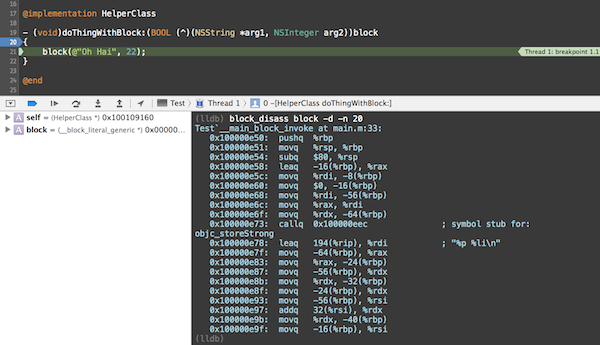
The disass_block_invoke_function function first finds the address of the invoke function by adding 16 (8 bytes for isa pointer and 4 bytes for each integer) to the original address and then reads the pointer from the memory at this location by using the ReadPointerFromMemory on SBProcess. Assuming no error happened during the reading, we now have the invoke function pointer and we can construct an LLDB command to disassemble instructions starting from this address. Once constructed, we can tell the debugger (SBDebugger) to handle the command for us by invoking HandleCommand. And that’s it, the results of the disassembly should now be printed to the console.
def disass_block_invoke_function(debugger, process, block_address, instruction_count):
	# The `invoke` function is 16 bytes in the struct
	invoke_function_address = block_address + 16

	invoke_function_error = lldb.SBError()
	invoke_function_pointer = process.ReadPointerFromMemory(invoke_function_address, invoke_function_error)
	if not invoke_function_error.Success():
		print "Could not retrieve the block invoke function pointer"
		return

	disass_cmd = "disassemble --start-address " + str(invoke_function_pointer) + " -c " + str(instruction_count)
	debugger.HandleCommand(disass_cmd)
Next, we will be retrieving the block signature and print it by mean of NSMethodSignature. Given that a block might not have a signature and, if it does, its position in the descriptor struct will depend on the presence of a copy and dispose function pointers we will want to first inspect the flags.
The flags integer is located 8 bytes in the block struck so we can find its address and read it from memory by using the ReadUnsignedFromMemory function on SBProcess. Since flags is an integer, we specify 4 as the number of bytes to read.
flags_address = block_address + 8	# The `flags` integer is 8 bytes in the struct

flags_error = lldb.SBError()
flags = process.ReadUnsignedFromMemory(flags_address, 4, flags_error)
We can then inspect these flags and find out whether the block has a signature, a copy_helper and a dispose_helper function pointers (see the Block_private.h header for an explanation of these flags).
block_has_signature = ((flags & (1 << 30)) != 0)
block_has_copy_dispose_helpers = ((flags & (1 << 25)) != 0)
Keeping this in mind, we can get the address of the descriptor struct pointer and read it from memory. Eventually, we can get to the signature address by adding 16 (8 bytes for each unsigned long integer) + another 16 (8 bytes for each function pointer) if the block has copy and dispose helper function pointers.
Since the signature is typed as const char * we can read it as a C string. Thankfully there is a ReadCStringFromMemory function on SBProcess that we can use to retrieve it.
block_descriptor_address = block_address + 24

block_descriptor_error = lldb.SBError()
block_descriptor = process.ReadPointerFromMemory(block_descriptor_address, block_descriptor_error)
if not block_descriptor_error.Success():
	print "Could not read the block descriptor struct"
	return

signature_address = block_descriptor + 16
if block_has_copy_dispose_helpers:
	signature_address += 16

signature_pointer_error = lldb.SBError()
signature_pointer = process.ReadPointerFromMemory(signature_address, signature_pointer_error)

signature_error = lldb.SBError()
signature = process.ReadCStringFromMemory(signature_pointer, 256, signature_error)
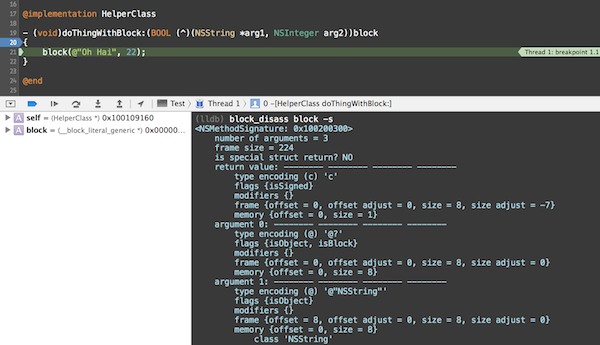
With the signature in hand, we can now create a command to create an NSMethodSignature and print it to the console. Similarly to the disassembly, we’ll ask the debugger to handle the command for us.
method_signature_cmd = 'po [NSMethodSignature signatureWithObjCTypes:"' + escaped_signature + '"]'
debugger.HandleCommand(method_signature_cmd)
And that’s it!
The easier way to use the script is to add the following line to ~/.lldbinit
command script import /path/to/the/script/block.py
With this in place, you should be able to simply call block_disass in the debugger.
The script is on GitHub. Have a look at it at the README in particular for a list of the supported arguments.
Being able to write Python scripts with the lldb module is extremely powerful and opens the door to dozens of applications. You can read more about the Python reference and API on the LLVM website.