Setting up my home office
Between Covid-19 and moving into a new house, it was finally time to setup a proper home office (I used to work at the kitchen table whenever I worked from home in the past which was not the most productive environment).
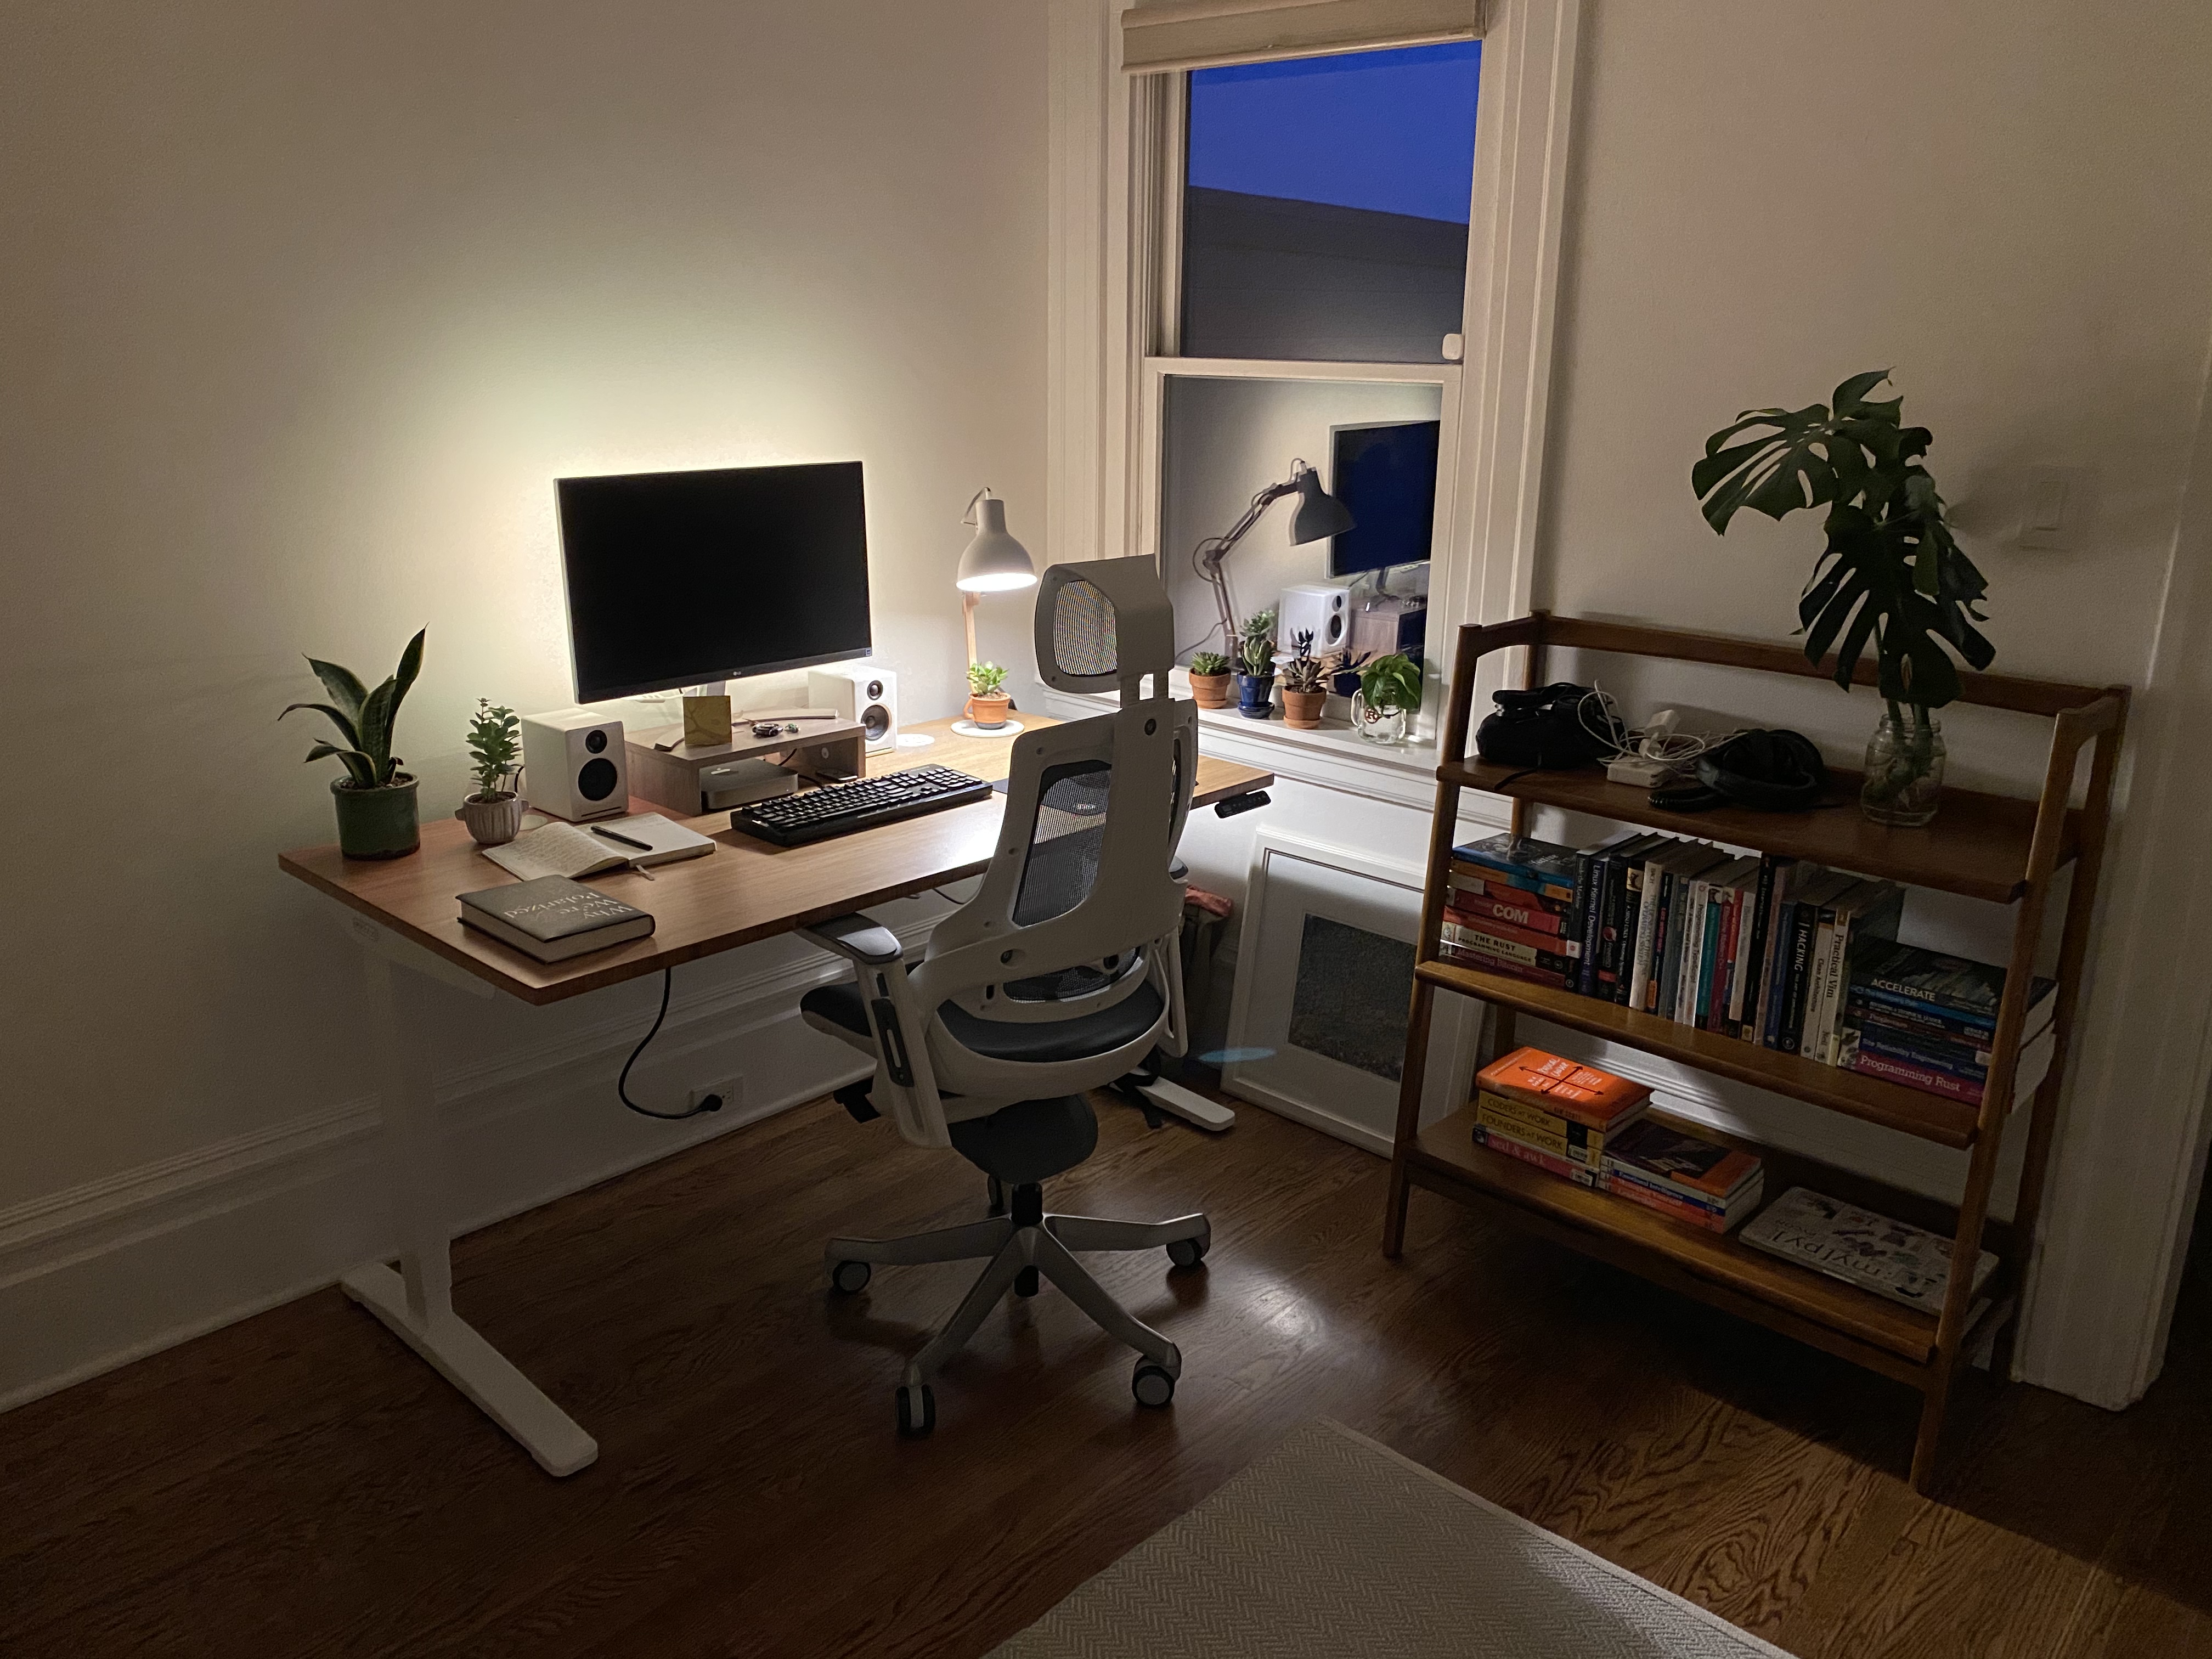
I’m pretty happy with the result. The desk and chair are from UpliftDesk. There’s plenty of light coming from the window during the day and the little plants definitely warm up the place.
I’m still not a huge fan of WFH and, for one, cannot wait to get back to the office, but for the time being I’m actually enjoying the time I get to spend here.
This site is now secure
I’m a little bit late to the party but this site is now served over TLS and is thus marked as "secure" in browsers.
This blog was originally using Jekyll and was hosted on GitHub Pages, which didn’t use to have support for HTTPS when using a custom domain (which I did). They seem to have added support for it recently but I procrastinated and never actually switched.
As I was looking at updating some of the content on the about page, I decided that it was time to start supporting HTTPS and since checking a single checkbox on GitHub didn’t seem quite fun enough, I actually rebuilt the static content generation and decided to host the site on my own box (well, a shared box on Digital Ocean really). Sure, I could have kept Jekyll but I didn’t love the fact that it took something like 10 seconds to generate a few dozens HTML pages when my simple Rust program takes a fraction of a second.
Digital Ocean and Let’s Encrypt really make it trivial to serve a simple static website over TLS. Only a couple of minutes to create a new instance, set up Nginx and kick off certbot to get an SSL certificate from Let’s Encrypt.
xnu-make: a simple project to build and install the XNU kernel
As you probably know, the Mac OS X kernel, XNU, is open source and building it from source is fairly straightforward (thanks to yearly instructions by Shantonu Sen).
However, building the kernel requires one to install a couple of dependencies that are not available on a Mac OS X installation by default (such as ctfconvert, ctfdump and ctfmerge that are part of the Dtrace project).
Since these dependencies are installed in the local Xcode Developer directory (or in /usr/local, as long as it’s in your PATH), one needs to install them on each new machine that one wants to build XNU on. Similarly, building libsyscall requires one to modify the local Mac OS X SDK in Xcode which might not always be desirable.
Finally, installing XNU and the respective libsystem_kernel.dylib user-space dynamic library requires a bunch of copying and manual terminal commands to be executed which is not ideal when one wants to quickly deploy a new version of the kernel to a virtual machine for example.
For this reason, I’ve written xnu-make that should make the process of building, installing and deploying XNU to a remote machine a bit more self contained and straightforward.
Currently xnu-make is composed of a Makefile and two simple scripts: install.sh and deploy.sh. It packages XNU and dependencies as submodules and the Makefile takes care of building the kernel, libsyscall and dependencies without touching your Xcode installation or current Mac OS X SDK (it actually makes a copy of the SDK, updates it while building and symlinks it so that Xcode can find it should you need to). Then, the scripts take care of installing the kernel, libsyscall, clearing the various kext and dyld caches and offering you to reboot. install.sh will take care of installing on your local machine (which you should probably never want, unless you’re building from a VM) and deploy.sh will copy the build output and install them on a remote host (such as a VM or a physical remote machine).
You can find xnu-make on GitHub. I’m hoping to improve it over time (I haven’t really tested the user space components installation much for example) but I think it’s a good starting point and it’s, at least, making my life a little bit easier.
Using the VMware Fusion GDB stub for kernel debugging with LLDB
In a previous post I discussed kernel debugging with VMware Fusion and LLDB. In that approach we were connecting LLDB to the kernel via the Kernel Debugging Protocol (KDP). That method works thanks to a stub implemented in the (target) kernel itself. One drawback we discussed was not being able to halt the kernel execution from the debugger and instead requiring a slightly cumbersome keyboard shortcut to generate a NMI on the target VM.
After publishing the article I received some very great feedback including a tweet from Ryan Govostes:
VMware Fusion has a GDB stub built-in, which lldb can talk to if you load a target definitions file.
To be fair I didn’t have a clear idea of what this exactly meant when I first read it but since it sounded pretty interesting I started doing some research.
I found a great post by snare that explains how to use GDB to connect to the remote debug stub in VMware Fusion and debug the target kernel from the host machine.
I will briefly discuss the approach here and then show how we can instead use LLDB to connect to the remote.
GDB stub in VMware Fusion
It turns out that VMware Fusion implements the GDB stub. I don’t think it is a documented feature (all mentions I’ve found about it were from users in the VMware forums) but it can be enabled by setting a preference. Each VM file contains a .vmx config file in the .vmwarevm package that can be edited (make sure that the VM is not running while you edit it).
Open it in a text editor and add the following line:
# If you are debugging a 32-bit machine use `guest32`
debugStub.listen.guest64 = "TRUE"
With this in place and after rebooting, the VM will listen to connections on the 8864 port (8832 if you’re using guest32) on localhost.
If you wanted to connect from another machine you could use a different option instead and would need to connect to the IP used by the VM:
# If you are debugging a 32-bit machine use `guest32`
debugStub.listen.guest64.remote = "TRUE"
For our use case we will simply connect to localhost so no need for the remote part.
GDB debugging stub
Before explaining how to connect from GDB let’s quickly discuss what is the GDB stub.
In order to setup a communication between two hosts, we need (among other things) a transmission protocol and an application protocol that both client and server can understand. Then obviously both server and client need to have code that is able to send, receive and interpret packets that come through.
This whole system is implemented as GDB Remote and consists of mainly four parts:
- TCP as the transmission protocol (KDP on the other hand uses UDP).
- The Remote Serial Protocol as the application protocol. It is a well-documented protocol and one rarely needs to know the details of it.
- The client side of the connection is GDB and, as expected, knows how to connect to the remote and understands the Remote Serial Protocol to send and receive packets.
- The server side of the connection is the tricky part since it’s the guest system and rarely has any knowledge of GDB and how to act as a remote out of the box. In order for the debugged program to allow connecting to GDB, one would use either one of these two solutions:
- Using
gdbserver, which is a control program for Unix-like systems that allows you to connect your program with a remote GDB. It can be a good option if you have no or little control over the target environment. The docs explaingdbserverin much more details. - Implementing the GDB debugging stub on the target. By doing so a program can itself implement the target side of the communication protocol. The official docs have a lot more info if you’re interested in the particular implementation.
In the case of VMware Fusion, a full GDB remote stub is implemented by the virtual machine and can be enabled by setting the option described above, allowing a remote GDB session to connect to the VM.
GDB Remote
With the debugStub.listen.guest64 option set and the VM rebooted, we can start a GDB session on the host machine and attempt to connect to the VM.
(gdb) file /Library/Developer/KDKs/KDK_10.10.5_14F27.kdk/System/Library/Kernels/kernel.development
Reading symbols from /Library/Developer/KDKs/KDK_10.10.5_14F27.kdk/System/Library/Kernels/kernel.development...Reading symbols from /Library/Developer/KDKs/KDK_10.10.5_14F27.kdk/System/Library/Kernels/kernel.development.dSYM/Contents/Resources/DWARF/kernel.development...
done.
(gdb) target remote localhost:8864
Remote debugging using localhost:8864
0xffffff800f9f1e52 in ?? ()
And at this point we are connected to the remote through the debug stub and we can do anything in the debugger (forget about the missing symbols here, I haven’t looked too much into it). After continuing, one can stop the kernel execution by doing ^c in the debugger as usual.
However, I had to install GDB on my host just to try this out (GDB stopped shipping with OS X since Mavericks) and I’d really like to use LLDB wherever I can since it’s what I’m most familiar with nowadays.
Connecting LLDB to a GDB remote stub
LLDB actually has support for connecting to a GDB remote out of the box with the gdb-remote command. To quote the LLDB docs:
To enable remote debugging, LLDB employs a client-server architecture. The client part runs on the local system and the remote system runs the server. The client and server communicate using the gdb-remote protocol, usually transported over TCP/IP.
In particular, the LLDB-specific extensions are discussed in a fantastic document in the LLDB repo.
LLDB has added new GDB server packets to better support multi-threaded and remote debugging. Why? Normally you need to start the correct GDB and the correct GDB server when debugging. If you have mismatch, then things go wrong very quickly. LLDB makes extensive use of the GDB remote protocol and we wanted to make sure that the experience was a bit more dynamic where we can discover information about a remote target with having to know anything up front. [...] Again with GDB, both sides pre-agree on how the registers will look (how many, their register number,name and offsets). We prefer to be able to dynamically determine what kind of architecture, OS and vendor we are debugging, as well as how things are laid out when it comes to the thread register contexts. Below are the details on the new packets we have added above and beyond the standard GDB remote protocol packets.
So we should be able to just connect to the remote system from LLDB? Let’s find out.
(lldb) file /Library/Developer/KDKs/KDK_10.10.5_14F27.kdk/System/Library/Kernels/kernel.development
Current executable set to '/Library/Developer/KDKs/KDK_10.10.5_14F27.kdk/System/Library/Kernels/kernel.development' (x86_64).
(lldb) gdb-remote 8864
Kernel UUID: C75BDFDD-9F27-3694-BB80-73CF991C13D8
Load Address: 0xffffff800f800000
Kernel slid 0xf600000 in memory.
Loaded kernel file /Library/Developer/KDKs/KDK_10.10.5_14F27.kdk/System/Library/Kernels/kernel.development
Loading 87 kext modules ....................................................................................... done.
Target arch: x86_64
Connected to live debugserver or arm core. Will associate on-core threads to registers reported by server.
Process 1 stopped
* thread #3: tid = 0x0066, name = '0xffffff801c91d9c0', queue = 'cpu-0', stop reason = signal SIGTRAP
    frame #0: 0xffffffffffffffff
Cool! So we were able to connect to the GDB stuff on the VM system. Let’s try and get a backtrace and see how things look.
(lldb) thread backtrace
* thread #3: tid = 0x0066, name = '0xffffff801c91d9c0', queue = 'cpu-0', stop reason = signal SIGTRAP
  frame #0: 0xffffffffffffffff
Hmm, that’s not a lot of information. Also, the only frame being at address 0xffffffffffffffff doesn’t sound right either.
LLDB target definition
Remember that Ryan’s tweet mentionned a target definitions file? I did some more research and found that other tweet from Shantonu Sen that pointed me to the right approach.
We can download the x86_64_target_definition.py file and use it as our plugin.process.gdb-remote.target-definition-file in LLDB’s settings.
# You can alternatively add this to the `.lldbinit` so that it's loaded whenever lldb starts
(lldb) settings set plugin.process.gdb-remote.target-definition-file /path/to/x86_64_target_definition.py
The file has a great comment explaining what the target definition does and why it is necessary.
This file can be used with the following setting:
plugin.process.gdb-remote.target-definition-fileThis setting should be used when you are trying to connect to a remote GDB server that doesn't support any of the register discovery packets that LLDB normally uses.
Why is this necessary? LLDB doesn't require a new build of LLDB that targets each new architecture you will debug with. Instead, all architectures are supported and LLDB relies on extra GDB server packets to discover the target we are connecting to so that is can show the right registers for each target. This allows the GDB server to change and add new registers without requiring a new LLDB build just so we can see new registers.
This file implements the x86_64 registers for the darwin version of GDB and allows you to connect to servers that use this register set.
Let’s try to use gdb-remote after setting the target definition file.
(lldb) settings set plugin.process.gdb-remote.target-definition-file /path/to/x86_64_target_definition.py
(lldb) file /Library/Developer/KDKs/KDK_10.10.5_14F27.kdk/System/Library/Kernels/kernel.development
Current executable set to '/Library/Developer/KDKs/KDK_10.10.5_14F27.kdk/System/Library/Kernels/kernel.development' (x86_64).
(lldb) gdb-remote 8864
Kernel UUID: C75BDFDD-9F27-3694-BB80-73CF991C13D8
Load Address: 0xffffff800f800000
Kernel slid 0xf600000 in memory.
Loaded kernel file /Library/Developer/KDKs/KDK_10.10.5_14F27.kdk/System/Library/Kernels/kernel.development
Loading 87 kext modules ....................................................................................... done.
Target arch: x86_64
Connected to live debugserver or arm core. Will associate on-core threads to registers reported by server.
Process 1 stopped
* thread #3: tid = 0x0066, 0xffffff800f9f1e52 kernel.development`machine_idle + 370 at pmCPU.c:174, name = '0xffffff801c91d9c0', queue = 'cpu-0', stop reason = signal SIGTRAP
    frame #0: 0xffffff800f9f1e52 kernel.development`machine_idle + 370 at pmCPU.c:174
It already looks better. Let’s now try to get a backtrace:
(lldb) thread backtrace
* thread #3: tid = 0x0066, 0xffffff800f9f1e52 kernel.development`machine_idle + 370 at pmCPU.c:174, name = '0xffffff801c91d9c0', queue = 'cpu-0', stop reason = signal SIGTRAP
  * frame #0: 0xffffff800f9f1e52 kernel.development`machine_idle + 370 at pmCPU.c:174
    frame #1: 0xffffff800f8fddb3 kernel.development`processor_idle(thread=0x0000000000000000, processor=0xffffff80100ef658) + 179 at sched_prim.c:4605
    frame #2: 0xffffff800f8fe300 kernel.development`idle_thread + 32 at sched_prim.c:4729
    frame #3: 0xffffff800f9ea347 kernel.development`call_continuation + 23
Perfect! We have a complete symbolicated trace and the addresses now look correct.
In practice
To make sure that things are working as expected, let’s set a breakpoint on forkproc (this function is used to create a new process structure given a parent process and is called from the fork syscall) and make sure that our breakpoint is hit and that we can inspect the frame arguments.
(lldb) breakpoint set --name forkproc
Breakpoint 1: where = kernel.development`forkproc + 20 at cpu_data.h:330, address = 0xffffff8006da6414
(lldb) continue
Process 1 resuming
Process 1 stopped
* thread #6: tid = 0x0f4c, 0xffffff8006da6414 kernel.development`forkproc(parent_proc=0xffffff8013f37b00) + 20 at cpu_data.h:330, name = '0xffffff8013e4f9c0', queue = 'cpu-1', stop reason = breakpoint 1.1
    frame #0: 0xffffff8006da6414 kernel.development`forkproc(parent_proc=0xffffff8013f37b00) + 20 at cpu_data.h:330
(lldb) thread backtrace
* thread #6: tid = 0x0f4c, 0xffffff8006da6414 kernel.development`forkproc(parent_proc=0xffffff8013f37b00) + 20 at cpu_data.h:330, name = '0xffffff8013e4f9c0', queue = 'cpu-1', stop reason = breakpoint 1.1
  * frame #0: 0xffffff8006da6414 kernel.development`forkproc(parent_proc=0xffffff8013f37b00) + 20 at cpu_data.h:330
    frame #1: 0xffffff8006da6d69 kernel.development`cloneproc(parent_task=0xffffff80135c7718, parent_coalition=0xffffff80135c4400, parent_proc=0xffffff8013f37b00, inherit_memory=0, memstat_internal=0) + 41 at kern_fork.c:977
    frame #2: 0xffffff8006da6038 kernel.development`fork1(parent_proc=0xffffff8013f37b00, child_threadp=0xffffff8014613ac0, kind=<unavailable>, coalition=<unavailable>) + 328 at kern_fork.c:554
    frame #3: 0xffffff8006d9b441 kernel.development`posix_spawn(ap=0xffffff8013f37b00, uap=<unavailable>, retval=0xffffff80135d0040) + 1937 at kern_exec.c:2078
    frame #4: 0xffffff8006e2c0c1 kernel.development`unix_syscall64(state=0xffffff80135db540) + 753 at systemcalls.c:368
    frame #5: 0xffffff8006a0e656 kernel.development`hndl_unix_scall64 + 22
(lldb) p *(struct proc *)$rdi
    (struct proc) $1 = {
      p_list = {
        le_next = 0xffffff80177e6cf0
        le_prev = 0xffffff801610d840
      }
      p_pid = 275
      task = 0xffffff801776cd08
      ...
Everything is working as expected, our breakpoint is hit, we can get a complete backtrace and print the first argument (a reference to the parent process structure that we want to fork from, I’ve cut the output, the proc struct is huge).
Conclusion
We showed an alternative approach to do remote debugging with VMware Fusion and LLDB. This method has some advantages over KDP since it lets us interrupt the execution of the program from the debugger at any time and doesn’t require us to use a NMI from the target VM to give control to the debugger on the host.
I’ve read that this method is also faster but I haven’t noticed a major difference in my testing so far. I’m sure heavy use of both methods will provide much more insights in that regard.
Thanks to Ryan Govostes for the idea, snare for the great post, Shantonu Sen for the target definition solution and VMware for making an awesome product.
Kernel debugging with LLDB and VMware Fusion
Being able to use LLDB to debug anything on my Mac has been the basis of my job for the last few years. Regardless of the particular use case – to debug my own program in Xcode or attach to another process – being able to set up breakpoints and inspect a program call stack frames and memory at runtime is just invaluable.
However, there’s one case where one cannot easily attach a debugger at any time: the kernel. Even if you could attach to the kernel on your local machine and halt its execution while you’re having a look around, the debugger wouldn’t be able to do much since it relies on the kernel to do, well anything. An alternative approach would be to use printf or IOLog and call it a day but that’s just not how I roll. If I need to debug something, I want a debugger.
In this article, we will discuss how one can set up a VMware Fusion virtual machine (VM) and use LLDB to do remote kernel debugging. Note that this approach could be used to debug any process remotely – which can be very useful for system critical processes such as launchd – but in this article we will mostly focus on the XNU kernel.
Setup
Setting up your environment for kernel debugging isn’t too hard but it can seem daunting at first since not much documentation is available.
In the old days, one would have needed to use two physical machines connected with an ethernet or firewire cable. However, nowadays one can easily install OS X on a VMware Fusion virtual machine. Since using multiple OS X systems on a single machine is pretty cool, we will setup the VM and discuss how to connect the debugger from the host.
I will assume that you are using VMware Fusion 7 and OS X 10.10.5. All this should very likely work with previous and later versions of VMware Fusion (or other virtualization products such as Parallels or VirtualBox, though I’m not sure since I’ve never used them) and OS X. It’s important to note however that El Capitan introduces System Integrity Protection that makes some breaking changes with respect to the boot-args arguments. I will update this article when El Capitan ships and the updated approach is final.
On the virtual machine
Install OS X 10.10
You will need to install the same version of OS X on the host system and the virtual machine. This is not technically required but it will make things easier. I’m currently using 10.10.5 but any version of Yosemite should work in the same way.
Install the Kernel Debug Kit
You should install the Kernel Debug Kit (KDK) from Apple Developer Downloads page. Make sure to pick the KDK that matches the version of OS X that you’re installed. The kit is a simple package install that you should run. It will install some components under /Library/Developer/KDKs.
If you take a look through this directory after installing, you should see something like this:
/Library/Developer/KDKs
    KDK_10.10.5_14F27.kdk
        ReadMe.html
        System
            Library
                Extensions
                    AppleUSBAudio.kext
                    AppleUSBAudio.kext.dSYM
                    ...
                Kernels
                    kernel.debug
                    kernel.debug.dSYM
                    ...
You now have a copy of the kernel itself and each kernel extension that Apple ships with the system, including the symbols for each of these executables. There is also a development and debug versions of the kernel that we will use in the VM.
The ReadMe.html file also has a ton of information about the KDK so make sure you at least skim through.
You will need the KDK to be installed on both the host and the VM:
- It is needed on the VM to install the development version of the kernel
- It is needed on the host in order for the debugger to use as the target or simply resolve the symbols
Install the development kernel
On OS X 10.10, the kernel executable is located under /Systems/Library/Kernels.
The KDK comes with a development and debug version of the kernel. To quote the KDK ReadMe.html docs:
The OS X Yosemite Kernel Debug Kit includes the DEVELOPMENT and DEBUG kernel builds. These both have additional assertions and error checking compared to the RELEASE kernel. The DEVELOPMENT kernel can be used for every-day use and has minimal performance overhead, while the DEBUG kernel has much more error checking.
It’s not technically required to install and boot into the development kernel to do kernel debugging (since the KDK has the symbols for the shipping kernel too and, as far as I can tell, the release kernel ships with the kdp_* symbols required for remote debugging) but we could definitely use the additional assertions and error checking so we will use it.
In order to install a distinct build of the kernel, there are two steps to take. We will discuss the boot-args changes in a following section so for now, we only need to copy the kernel in the right location.
To do so, you will need to copy the kernel.development executable located under the KDK install directory to /Systems/Library/Kernels:
# `KDK_10.10.5_14F27.kdk` is your current KDK install
damien$ sudo cp /Library/Developer/KDKs/KDK_10.10.5_14F27.kdk/System/Library/Kernels/kernel.development /Systems/Library/Kernels
With this in place, your system can boot into the development kernel, assuming it’s told how to do so.
Update the NVRAM boot-args
The non-volatile random-access memory (NVRAM) is memory that retains its information when power is turned off. In particular, it can contain boot arguments that the system checks when booting. On OS X, its variables can be queried and manipulated by using the nvram command line utility. Note that this is drastically changing with OS X El Capitan but as far as Yosemite is concerned, nvram is the right tool to change boot arguments.
In order to set up our VM for debugging we will need to update the boot arguments by running the following command:
damien$ sudo nvram boot-args="debug=0x141 kext-dev-mode=1 kcsuffix=development pmuflags=1 -v"
where each boot argument does a very specific thing:
debug=0x141enables the debug mode and sets a few debug options such as ensuring that the system on the VM waits for a remote debugger connection when booting. The Kernel Programming Guide has more info about the various options. Here we are using(DB_HALT | DB_ARP | DB_LOG_PI_SCRN).kext-dev-mode=1allows us to load unsigned kexts. This is not required if you’re only tweaking with the kernel itself but if you’re developing a kernel extension and don’t have a kext-enabled Developer ID certificate to sign it with, this will allow you to load your kext while debugging.kcsuffix=developmentallows us to boot with the development kernel that we previously copied on the system (change tokcsuffix=debugto boot the debug one).pmuflags=1disables the watchdog timer. The Kernel Programming Guide has much more info about this option.-venables the kernel verbose mode that will be useful when debugging.
Retrieve the VM network configuration info (Optional)
In order to connect the debugger to the VM, we will need some info about its network configuration. We will need to change a few things on the host system but on the VM we only need to retrieve the network interface parameters and note them somewhere.
damien$ ifconfig
en0: flags=8863<UP,BROADCAST,SMART,RUNNING,SIMPLEX,MULTICAST> mtu 1500
  options=b<RXCSUM,TXCSUM,VLAN_HWTAGGING>
  ether 00:0d:29:56:8a:70
  inet6 fe80::20c:29ff:fe56:8a70%en0 prefixlen 64 scopeid 0x4
  inet 192.168.156.140 netmask 0xffffff00 broadcast 192.168.156.255
  nd6 options=1<PERFORMNUD>
  media: autoselect (1000baseT <full-duplex>)
  status: active
...
Make sure to write down the MAC address (ether, here 00:0d:29:56:8a:70) and IP address (inet, here 192.168.156.140) somewhere.
Invalidate the kext cache
We need to invalidate the kext cache to use the new kernel for debugging. This can easily be done by running the following command:
# / means the root of the current volume, you can specify another volume if needed
damien$ sudo kextcache -invalidate /
Reboot
Finally, we need to reboot the VM for all these changes to get picked up. If your system is then stuck on some console output, feel free to shut it down for now. We’ll look into this once we have the host setup for debugging.
damien$ sudo reboot
On the host machine system
With the VM setup, we now need to set things up for debugging on the host system.
Install Xcode
In order to debug you will need Xcode to be installed on your system. You can download it from the Apple Developer page. Make sure that you launch it at least once to accept the license and install the additional tools.
Install the Kernel Debug Kit
As we previously said, the Kernel Debug Kit will also have to be installed on the host system for the debugger to use as the target and correctly symbolicate. The installation instructions are identical as the ones for the VM above.
Update the address translation table (Optional)
Optionally, we need to add an entry to the Internet-to-Ethernet address translation table for the VM network interface. We need this for the debugger to pick up the right interface when connecting to the VM IP address. The address translation table is basically a lookup table for IP addresses to MAC addresses.
With the IP address and MAC address for the VM that we wrote down earlier, we can run the following command:
# The `-S` option will add a new entry to the table, making sure to remove any existent entry for this IP first
sudo arp -S 192.168.156.140 00:0d:29:56:8a:70
Note that we can skip this by using the DB_ARP debug boot-args option as previously explained. This option is defined in the Kernel Programming Guide as:
Allow debugger to ARP and route (allows debugging across routers and removes the need for a permanent ARP entry, but is a potential security hole)—not available in all kernels.
This essentially means that the debugger itself can take care of this for us. If you’re using 0x145 for the debug boot-args option as shown above, you won’t need to do update the table entry. If you’re worried about security, feel free to use 0x105 as the option and add the entry to the table manually.
That’s it! Everything is setup, let’s try things in practice.
In practice
In order to test our setup, let’s say that we’re debugging the kernel and want to check what is calling the hfs_vnop_setxattr function and what the arguments are (this function writes the extended attribute data for a given vnode to the HFS+ store). We will want the debugger to break whenever this function is hit.
First, we’ll have to launch LLDB on the host machine and set the target to the (local) development kernel binary located in the KDK:
damien$ lldb
(lldb) target create /Library/Developer/KDKs/KDK_10.10.5_14F27.kdk/System/Library/Kernels/kernel.development
Current executable set to '/Library/Developer/KDKs/KDK_10.10.5_14F27.kdk/System/Library/Kernels/kernel.development' (x86_64).
Next, we need to launch the VM and wait for the boot screen to appear. After a few seconds, you should see the following message printed to the screen:
Darwin Bootstrapper Version 2.0.2: Sun Jul 5 21:53:13 PDT 2015; root:libxpc_executables-559.40.1~1/launchd/RELEASE_X86_64
boot-args = debug=0x001 kext-dev-mode=1 kcsuffix=development -v
IOKernelDebugger: registering debugger

ethernet MAC address: 00:0d:29:56:8a:70
ip address: 192.168.156.140

Waiting for remote debugger connection.
We can confirm that the MAC and IP addresses of the VM are the one that we noted before.
At this point, the host VM system is basically waiting for a debugger connection. Back to the LLDB session on the host machine, we can connect to the VM kernel by running the following command:
(lldb) kdp-remote 192.168.156.140
The VM will now print Connected to remote debugger and some info will also be printed to the LLDB console output.
(lldb) kdp-remote 192.168.156.140
Version: Darwin Kernel Version 14.5.0: Wed Jul 29 02:26:53 PDT 2015; root:xnu-2782.40.9~1/DEVELOPMENT_X86_64; UUID=C75BDFDD-9F27-3694-BB80-73CF991C13D8; stext=0xffffff8011200000
Kernel UUID: C75BDFDD-9F27-3694-BB80-73CF991C13D8
Load Address: 0xffffff8011200000
Kernel slid 0x11000000 in memory.
Loaded kernel file /Library/Developer/KDKs/KDK_10.10.5_14F27.kdk/System/Library/Kernels/kernel.development
Loading 50 kext modules .................................................. done.
Target arch: x86_64
Instantiating threads completely from saved state in memory.
Process 1 stopped
* thread #2: tid = 0x0123, 0xffffff80112bb4c8 kernel.development`kdp_register_send_receive(send=<unavailable>, receive=<unavailable>) + 392 at kdp_udp.c:463, name = '0xffffff801eae94d0', queue = '0x0', stop reason = signal SIGSTOP
    frame #0: 0xffffff80112bb4c8 kernel.development`kdp_register_send_receive(send=<unavailable>, receive=<unavailable>) + 392 at kdp_udp.c:463
At this point, we are stopped in the debugger and the VM kernel is waiting for us to continue. We will first set up our breakpoint:
(lldb) breakpoint set --name hfs_vnop_setxattr
Breakpoint 1: where = kernel.development`hfs_vnop_setxattr + 34 at hfs_xattr.c:711, address = 0xffffff800b548da2
We can now continue for the kernel to complete booting:
(lldb) continue
Process 1 resuming
A bunch of text will be output on both the debugger and the system console and eventually the VM system will boot. Shortly after booting (or likely during the boot process), our breakpoint should be hit.
Process 1 stopped
* thread #15: tid = 0x0195, 0xffffff8013b48da2 kernel.development`hfs_vnop_setxattr(ap=0xffffff80e230b290) + 34 at hfs_xattr.c:711, name = '0xffffff802177d1b0', queue = '0x0', stop reason = breakpoint 1.1
    frame #0: 0xffffff8013b48da2 kernel.development`hfs_vnop_setxattr(ap=0xffffff80e230b290) + 34 at hfs_xattr.c:711
Back in the LLDB debugger we can print information about the current stack trace and arguments:
(lldb) thread backtrace
* thread #15: tid = 0x0195, 0xffffff8013b48da2 kernel.development`hfs_vnop_setxattr(ap=0xffffff80e230b290) + 34 at hfs_xattr.c:711, name = '0xffffff802177d1b0', queue = '0x0', stop reason = breakpoint 1.1
  * frame #0: 0xffffff8013b48da2 kernel.development`hfs_vnop_setxattr(ap=0xffffff80e230b290) + 34 at hfs_xattr.c:711
    frame #1: 0xffffff801394df64 kernel.development`VNOP_SETXATTR(vp=0xffffff8021dcc000, name=<unavailable>, uio=<unavailable>, options=<unavailable>, ctx=<unavailable>) + 84 at kpi_vfs.c:5162
    frame #2: 0xffffff801394165d kernel.development`vn_setxattr(vp=0xffffff8021dcc000, name=0xffffff7f94247d3d, uio=0xffffff80e230b780, options=8, context=0xffffff8020ff9d90) + 589 at vfs_xattr.c:216
    frame #3: 0xffffff8013d21a3d kernel.development`mac_vnop_setxattr(vp=0xffffff8021dcc000, name=<unavailable>, buf=0xffffff8022813008, len=29) + 189 at mac_vfs_subr.c:173
    frame #4: 0xffffff7f94246777 Quarantine`quarantine_set_ea + 125
    frame #5: 0xffffff7f94245f37 Quarantine`hook_vnode_notify_open + 430
    frame #6: 0xffffff8013d19645 kernel.development`mac_vnode_notify_open(ctx=<unavailable>, vp=0xffffff8021dcc000, acc_flags=35) + 181 at mac_vfs.c:405
    frame #7: 0xffffff801393ea6a kernel.development`vn_open_auth [inlined] vn_open_auth_finish(vp=<unavailable>, fmode=35, ctx=<unavailable>) + 14 at vfs_vnops.c:193
    frame #8: 0xffffff801393ea5c kernel.development`vn_open_auth(ndp=<unavailable>, fmodep=0xffffff80e230b9fc, vap=<unavailable>) + 2220 at vfs_vnops.c:614
    frame #9: 0xffffff801392a095 kernel.development`open1(ctx=<unavailable>, ndp=0xffffff80e230bbf0, uflags=<unavailable>, vap=0xffffff80e230bd88, fp_zalloc=<unavailable>, cra=<unavailable>, retval=<unavailable>) + 549 at vfs_syscalls.c:3344
    frame #10: 0xffffff801392ac70 kernel.development`open [inlined] open1at(fp_zalloc=<unavailable>, cra=<unavailable>) + 32 at vfs_syscalls.c:3541
    frame #11: 0xffffff801392ac50 kernel.development`open [inlined] openat_internal(ctx=0xffffff8020ff9d90, path=140423473571856, flags=546, mode=<unavailable>, fd=-2, segflg=UIO_USERSPACE, retval=0xffffff8020ff9ca0) + 281 at vfs_syscalls.c:3674
    frame #12: 0xffffff801392ab37 kernel.development`open [inlined] open_nocancel + 18 at vfs_syscalls.c:3689
    frame #13: 0xffffff801392ab25 kernel.development`open(p=<unavailable>, uap=<unavailable>, retval=0xffffff8020ff9ca0) + 85 at vfs_syscalls.c:3682
    frame #14: 0xffffff8013c2c0c1 kernel.development`unix_syscall64(state=0xffffff8021009ea0) + 753 at systemcalls.c:368
    frame #15: 0xffffff801380e656 kernel.development`hndl_unix_scall64 + 22

(lldb) p *(struct vnop_setxattr_args *)$rdi
(struct vnop_setxattr_args) $71 = {
  a_desc = 0xffffff8013e61430
  a_vp = 0xffffff8021dcc000
  a_name = 0xffffff7f94247d3d "com.apple.quarantine"
  a_uio = 0xffffff80e230b780
  a_options = 8
  a_context = 0xffffff8020ff9d90
}
Almost magical!
It’s important to note that once the kernel has launched and the debugger continued, the kernel cannot be halted again from the debugger. In fact, if you try you will get an error message:
(lldb) process interrupt
error: Failed to halt process: KDP cannot interrupt a running kernel
For this reason, you should make sure that all your breakpoints are registered in the debugger before running continue for the kernel to complete its boot.
A note about Non-Maskable Interrupts (NMI)
In the section about boot-args, we discussed using (DB_HALT | DB_ARP | DB_LOG_PI_SCRN) as the flag for the debug option. This flag contains DB_HALT that gets the kernel to wait for a debugger to attach when it boots.
As you can imagine, it is not always necessary to attach a debugger at system boot and often one only wants to attach at panic time (or even at execution time). Luckily, there’s an option to drop into the debugger on an NMI: DB_NMI.
In order to do this, we will have to change the flags for the debug boot-args option to 0x144 which is (DB_NMI | DB_ARP | DB_LOG_PI_SCRN).
With this in place, the VM kernel will boot normally without waiting for a debugger to attach. Then, at any time during execution you can generate a NMI which gives an opportunity for the remote debugger to connect.
The way to generate a NMI from a virtual machine is not obvious. Older versions of OS X would use the power button only, as documented in the Technical QA1264. However, as discussed in the WWDC 2013 session 707 this was changed to Left Command + Right Command + Power on OS X 10.9. I don’t think it is possible to simulate the power button being pressed on VMware Fusion so, at first, I thought it was actually impossible to generate a NMI from the virtual machine.
However, after reading through the Kernel Programming Guide in more details I noticed that the DB_NMI option was documented as:
Drop into debugger on NMI (Command–Power, Command-Option-Control-Shift-Escape, or interrupt switch).
And indeed, using Command-Option-Control-Shift-Escape works beautifully in the VM!
If you hit this key combo in your VM at any time (including at panic time), execution will stop. Back to the host system, you can fire up LLDB and connect to the VM.
(lldb) target create /Library/Developer/KDKs/KDK_10.10.5_14F27.kdk/System/Library/Kernels/kernel.development
Current executable set to '/Library/Developer/KDKs/KDK_10.10.5_14F27.kdk/System/Library/Kernels/kernel.development' (x86_64).

(lldb) kdp-remote 192.168.156.140
Version: Darwin Kernel Version 14.5.0: Wed Jul 29 02:26:53 PDT 2015; root:xnu-2782.40.9~1/DEVELOPMENT_X86_64; UUID=C75BDFDD-9F27-3694-BB80-73CF991C13D8; stext=0xffffff8008800000
Kernel UUID: C75BDFDD-9F27-3694-BB80-73CF991C13D8
Load Address: 0xffffff8008800000
Kernel slid 0x8600000 in memory.
Loaded kernel file /Library/Developer/KDKs/KDK_10.10.5_14F27.kdk/System/Library/Kernels/kernel.development
Loading 93 kext modules ............................................................................................ done.
Target arch: x86_64
Instantiating threads completely from saved state in memory.
Process 1 stopped
* thread #2: tid = 0x00b8, 0xffffff80089f4e77 kernel.development`Debugger(message=<unavailable>) + 759 at model_dep.c:1013, name = '0xffffff8015e169a0', queue = '0x0', stop reason = signal SIGSTOP
    frame #0: 0xffffff80089f4e77 kernel.development`Debugger(message=<unavailable>) + 759 at model_dep.c:1013
And that’s it, as you can see that a SIGSTOP was sent in the VM kernel and back in the host debugger that’s where we’ve attached. From here we can do anything we would do in a debugger: inspect memory, print a backtrace, set a few breakpoints, etc… Once you’re done, you simply have to continue for the kernel to resume executing.
A note about kernel extensions and kernel patches
In this example, we’ve only set up breakpoints and inspected memory of the release kernel. If you plan to run a modified build of the kernel or more importantly if you are building a kernel extension, you will have to copy the .dSYM symbol file built along your kext to the host machine. It can be located anywhere that is indexed by Spotlight. When encountering an unknown symbol (for example a function in your kext), LLDB will look for a .dSYM file that matches this symbol’s Mach-O binary UUID. If the .dSYM file is on your host machine and was indexed by Spotlight then LLDB will symbolicate things nicely.
Conclusion
In this article, we presented how to set up an environment for kernel debugging. While it might sound daunting at first, we saw that it is actually pretty trivial to set up and once everything is in place, debugging the kernel is not more difficult than debugging a simple user-space application.